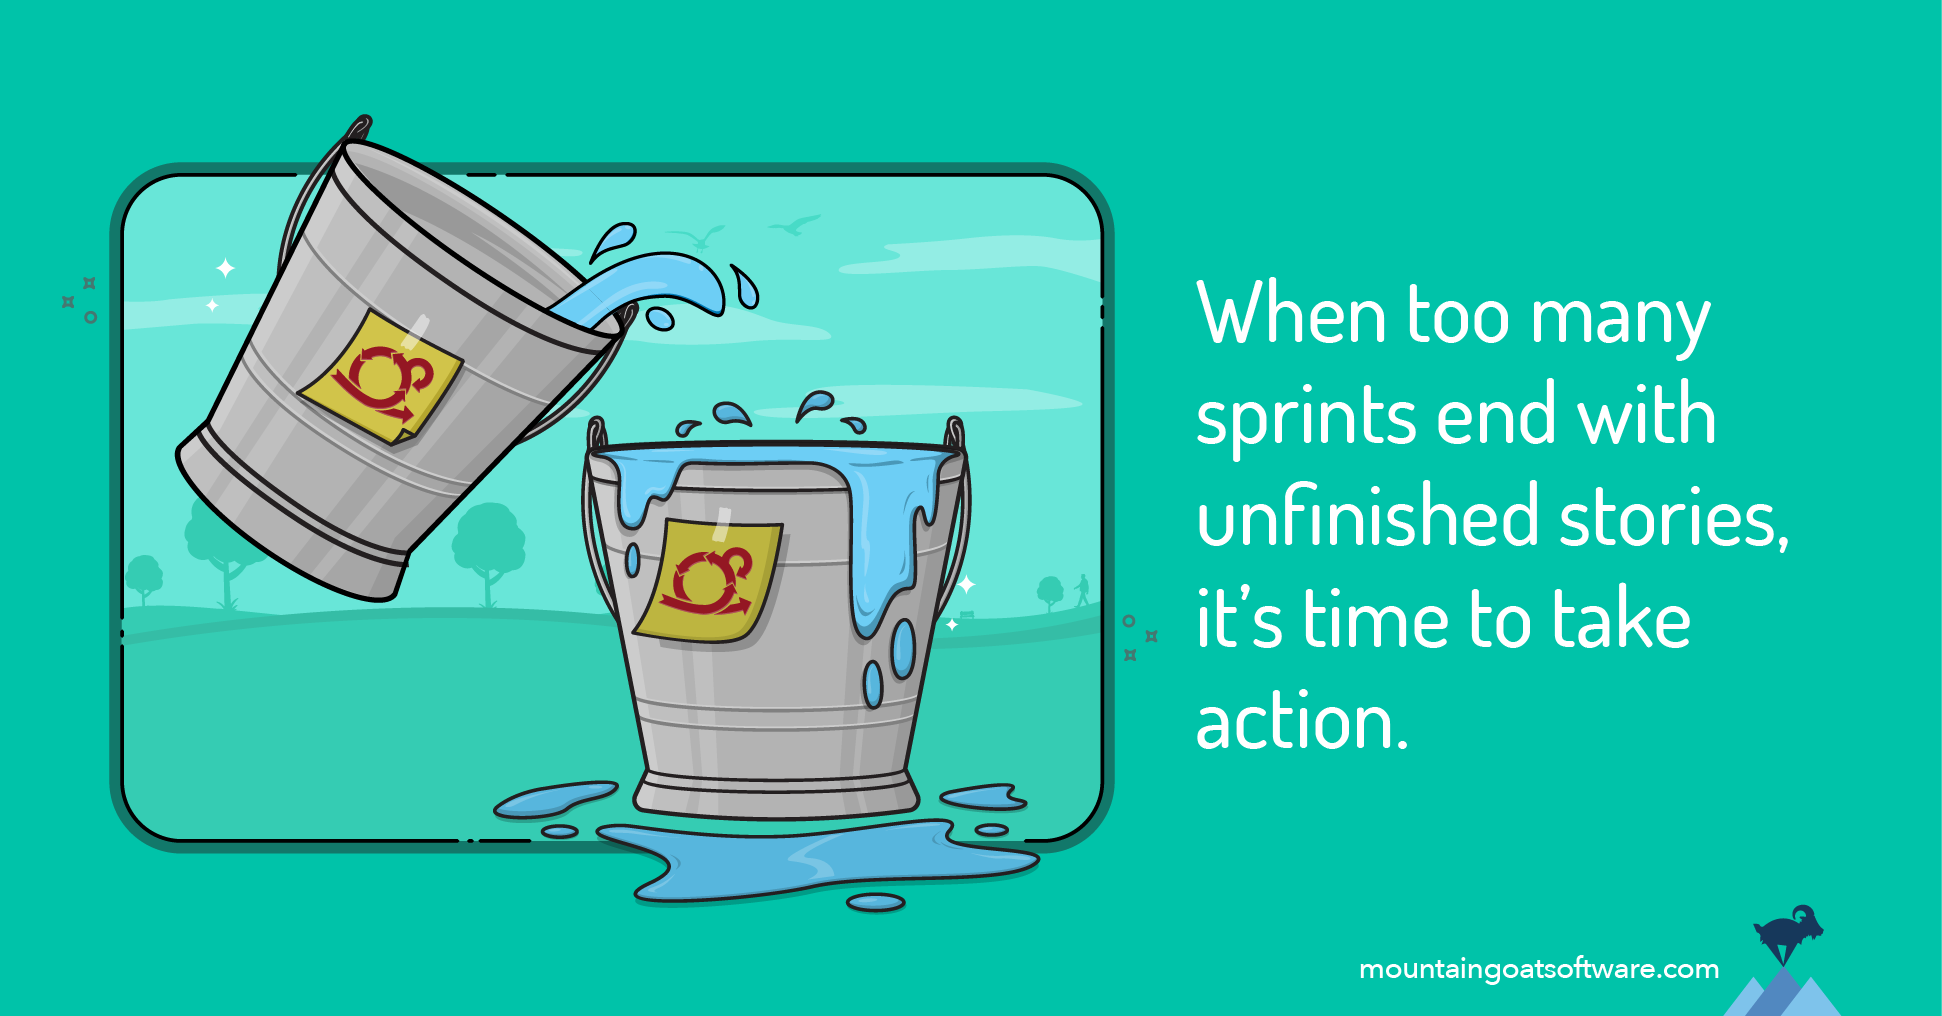
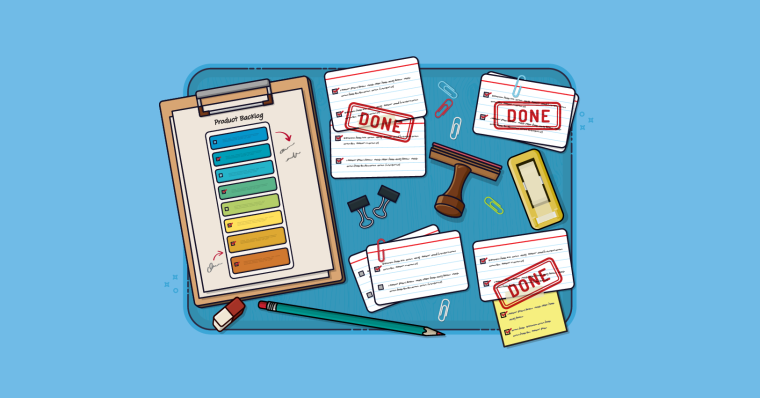
Using story points or ideal days to measure productivity is a bad idea because it will lead the team to gradually inflate the meaning of a point–when trying to decide between calling something “two points” or “three points” it is clear they will round up if they are being evaluated on productivity as measured by the number of story points (or ideal days) finished per iteration.
My view is that points can be used as the best way to estimate and assess progress that we’ve ever had or they can be used as another weapon with which to hit the team. There are plenty of weapons with which you can hit your team. We don’t need to ruin points by using them that way as well.
Some teams have measured productivity with things like the number of backlog items delivered or the % of backlog items completed vs. planned into a sprint. Teams will alter their behavior on those as well though so they can be gamed and misleading. These metrics can be useful but only as part of a suite of metrics collected at the end of each iteration.
If we rethink the question of “how do we measure productivity” we might get a better answer. Suppose you own a sandwich shop and want to measure the productivity of the sandwich maker in the back. He responds to our metric by making as many sandwiches as he can–regardless of whether anyone ordered them! At the end of the day there will be 200 extra sandwiches to throw away. A better measure of him might be how quickly he makes any sandwich. So we’d measure the time from when the customer placed the order until the sandwich is put on a tray. Or for a more complete metric we may want to measure the time from when he receives an order until he is ready to receive the next order as this captures any cleanup or restart time.
So, one measure we may want to include in our suite of metrics could be the responsiveness of the development organization. This would be measured in the same way as in the sandwich shop. Datestamp each product backlog item and track the time from when something enters the product backlog until it either (a) comes out of an iteration or (b) is delivered into the hands of customers. Choosing between (a) and (b) will largely be a matter of how often you ship software. Option (b) is a better measure of rapid delivery of customer value but is impractical in some cases. It would be a bit of a useless measure for the Microsoft Vista team, for example.
Tags: metrics, story points
hi Mike, I totally agree with you when you say that complexity points can’t be used as a productivity metric.
I was in workshop with several teams were playing to deliver some stories, in average all teams had the same stories so it was expected that the estimates and the delivered stories should be more or less the same for all teams (the teams were very much the same in experience).
But, one team was really delivering a lot more complexity points than the other five. What happened was exactly what you described in this post, the was inflating the complexity so that it could appear to be delivering more.
Hi Antonio–
First, I’d caution you from considering these “complexity points”. Complexity is a factor but is not the only one. Someone gave me the example recently of “perform brain surgery” which let’s say takes an hour. Another item is “lick 1000 postage stamps” which also takes an hour. One would have a complexity rating through the roof while the other would be as simple as it gets. I think this will be a good topic for my next blog posting so I won’t go into the points further right now (too much to say).
Second, what you saw is very prevalent. If teams feel the slightest indication that velocities will be compared between teams there will be gradual but consistent “point inflation.”
Hi Mike, thanks for your reply. I will be waiting for your next post.
But, what about if the responsiveness of the sandwich maker in the back is reverse proportional to the quality of the sandwiches? Then, at some important point, the maker will be responsive enough to make sandwiches that are below the minimum accepted quality level. And if he’s not doing the dishes, he will have a responsiveness debt to pay in the afternoon. Can we still call that productive?
My opinion: Many metrics that are easy measured can give valuable process feedback, even SLOC. The hard part is to avoid connecting prestige titles with them and to avoid using them as quality measures. If the trend in a team is decreased or increased scoring of story points, responsiveness or SLOC, then this is a sign of something that need to be analyzed. The analysis is unique to this team and can not be compared with decreased or increased scoring in another team. Responsiveness 3 is not necessary better than responsiveness 5 in another team – the values are orthogonal.
Mike,
I completely agree that once you start measuring or evaluating a team on something they will start changing the way they work to improve that metric regardless of whether that improves the software they are developing.
I like the idea of measuring “responsiveness” but wonder how you continue to ensure quality. It seems that some teams would compromise on their definition of “done” in order to be done quicker and would then introduce defect stories in future sprints to clean up. This is obviously not what you would want so it seems that you would need someone outside the team who is not being evaluated on this metric to enforce the definition of done.
Have you seen this problem in practice or am I being overly cynical?
See http://en.wikipedia.org/wiki/Throughput_accounting
Productivity = Throughput / OperatingExpense
where Throughput = Sales – CostOfRawMaterials
Hi Staffan–
In the example of the sandwhich shop, I am assuming that each person could perform the job adequately albeit perhaps at different speeds. This is a reasonable assumption in most cases and when it’s not the person should not do that part of a job–e.g., I never knew how to change the tape in the cash register so I wasn’t fully cross-trained.
I would rarely want to compare one team to another regardless of the metric. In general I want to look for team improvements or overall group/company improvements so I’m comparing like-groups over different time periods rather than dissimilar groups.
Hi Alex–
I personally haven’t seen that problem but have been on the lookout for it. I did, however, recently have someone at a client site email me something very similar to what you describe but with a very odd twist to it that I am anxious to blog about soon. I was in shock when I first read about what had happened there.
As with all these metrics, one of the keys is to have a balanced set of metrics. Don’t just pick one thing, pick multiple things to measure. This is the idea behind something called a “balanced scorecard.” Additionally, realize that any metric can be gamed so don’t put a lot of emphasis on it–e.g., no big bonuses should get paid when the metric improves. If it’s one of many easy-to-collect metrics that you gather and it’s importance isn’t overstated then the team isn’t likely to go too out of their way to show a false improvement.
Hi Keith–
Absolutely. I intentionally used both terms in the blog posting (“productivity” in the title; “throughput” in the body). The problem with throughput accounting is that nobody does it so it’s specific definitions aren’t the ones that come to mind when people hear the terms “productivity” and “throughput”.
From using those terms in classes and asking questions about them what people take them to mean, “productivity” is more closely related to how much time one spends working (with the associated assumption that the rate of work is consistent). So productivity is thought of as analogous to keeping the factory machine running a full 8 hours a day (or more). Most people take “throughput” as “the amount that came out at the end of the iteration,” which makes it a bit of a better term for what I’m describing.
The other advantage of “throughput” is that we don’t hear that word all the time. “Productivity” has been used so many times we don’t even pick up on it and think about its meaning.
For anyone interested in these topics, Thomas Corbett has a good book called Throughput Accounting (which is part of the Theory of Constraints. Also take a look at David Anderson’s very good Agile Management for Software Engineering.
Mike,
Excellent topic, and one that i’m interested to hear more on. What are ALL of the ‘good’ metrics to incent teams on? what are some more of the bad ones? When i worked at a major restaurant company IT department, each team was incented on personal ‘results’… things like lowering costs, increasing volume of tickets, decreasing time to ‘resolution’ (aka to closing) of tickets, lowering numbers of escalated tickets… ALl of these went horrible because issues never made it to the developers! Likewise in the current environment i’m in, we have no incentive at all except meeting our ‘milestones’ on time (it’s an sdlc shop unfortunately), which you know that just incents people to cut corners … which is one reason i’m leaving out of many.
I would just like to see the good,bad,ugly of incentives so in my new career path i can be on the lookout for these types of mistakes…even if i have no control over how they’re executed.
Hi James–I’ll definitely have more to say later about ways to measure.
[...] Inoltre, molto interessante è anche questo post di Mike Cohn sull’utilizzo degli Story Points come misura di produttività . agile estimation user story [...]
Has anyone published a list of suggested story point values for common web development stories. I’ve considered for a while putting together a “quick start” guide for web development items such as: A lister table with 10 fields and column sorting and create/delete/edit action buttons, a form with 10 fields with field validation, a simple page of formated text (h1, h2, normal) and 2 images, etc…. I don’t even know if its possible, but I’m interested in giving it a try or finding someone who’s done it.
Hi Keith–
I haven’t seen an attempt to do this. I’ve thought it as well. There’s no reason why a list of generic items couldn’t be created and given values that would hold for most projects. We have to be a bit careful in that technologies, tools, and current state of the system do come into play, though, in determining the size of an effort. For example, I was helping my daughters with their website this morning. It’s build using Apple’s iWeb software. Suppose there is a story of “As a user I want an RSS feed of any new photos added to the site.” This looks to be trivial in iWeb but in my coded http://www.mountaingoatsoftware.com site that feature would need some coding. Same story, same programmer, different sizes because of technology choices tat were made (iWeb vs. Rails).
Thanks Mike for the quick reply! I agree technology would be a big factor as certain technologies make certain tasks less effort than others. I’ll probably attack this sometime in the next couple months, putting together a list of common web tasks for Rails development (we use Rails). I’ll let you know how it goes.
By the way, I really enjoyed your AEAP book. I co-founded a startup in DC last year, and my team of 10 developers is running on your blend of Agile. I implemented pretty much your entire strategy, and we’ve had great success. I even presented on it at the local Ruby User Group here in Virginia as a case study on using Agile techniques to manage Rails projects. Can you drop me an email sometime? I’d like to get your contact info. Thanks!
Hi Keith–
Good luck with your startup.
For anyone who wants it, my email is mike@mountaingoatsoftware.com. Full contact information is on the Mountain Goat Software site at http://www.mountaingoatsoftware.com or click on the logo under the search field on the top right of any blog page.
-To James’es comments & To Mike
In my mind, some common failures on projects/products
a. Keeping an eye on wrong project progress metric(s)
(i.e. # of OPEN error reports, saying quality with no solid definition)
b. Not measuring all needed metrics
c. Not being able to understand the interactions between the metrics
d. When setting, reviewing the metrics, not taking into account:
– Teams’ / upper managements’ physicology
– Human desire to please & to go for the most benefitial
area
Lets keep in mind that waterfall functionality is always around and many things will be done acc.to (close to) good old ways as well.
A) Project wise:
I would suggest, to take into account:
(a) The health indicators of Scrum
(b) Projects goals
(c) Customer feedback
So:
(1) Number of Definition of Done items MISSED for each User Story, which is in “completed” state
(2) Number of Definition of items COMPLETED for each User Story, which is in “completed” state
(3) A working build environment, continuus integration
(4) Test Automation: If automation apply/possible, number user stories that can be test-automated
(5) Coverage results: Why to write/ship software you havent tested ?
(6) (Mike’s) The time from when something enters the product backlog until it either
(a) comes out of an iteration or
(b) is delivered into the hands of customers.
“As stated, between (a) and (b) will largely be a matter of how often you ship software.”
(7) Customer feedback per user story
(8) Ability to give visibility on the projects progress via project’s teams’ velocity
(1) & (2) could be useful, especially during transition to Agile. As we know, the good old ways of working will be around quite a while. Teams could be rewarded to increase the COMPLETED items and decrease the MISSED items.
(3) is a must, especially projects with multiple teams. Otherwise, the tendency is not to get small incremental tasks and to integrate big bang changes. Important, there is no time limit here! As any given target may make little sense.
To me, (1)-(5) are the health indicators of the development process. (6) is more generic and it gets closely effected by (1)-(5).
Keeping (1)-(5) as teams performance metrics could ensure their focus on obstacles & wastes on their way to achive them. Without (1)-(5), existing waterfall mindset could force to push only (6) and may ignore missing tasks.
In my opinion, ideal days & story points are largely varying for teams dynamics/capabilities/technologies/tools. Therefore, they are not healty ways of measuring progress.
B) Product / Platform Wise
As many complex & interdependent projects get into a product, we have build environment setup, integration, system testing issues:
(1) A working build environment, continuus integration system for all projects
(2) Each project can develop its own functionality using the integrated environment
(3) (Automated) tests for project’s individual functionality can be run using the integrated environment
(4) (Automated) tests for project’s collaborative functionality can be run using the integrated environment
(5) For the user stories which contains interaction between projects: (Mike’s) The time from when something enters the product backlog until it either:
(a) comes out of an iteration or
(b) is delivered into the hands of customers.
“As stated, between (a) and (b) will largely be a matter of how often you ship software.”
(6) Customer feedback (i.e. on speed, on timing of delivery, on features etc)
(7) Ability to give visibility on the products progress via project’s teams’ velocity
The intention is to keep an eye on the health measures of incremental development first
* On individual projects
* On the product/platform as a whole
As these measures are focused to employees as a measure of success, then they target their efforts for their own
personal purposes too.
There is no deadline in these metrics. Acc.to Scrum, there is time boxing. People will learn over time
)
to commit to right amount of work (hopefully
Finally, financially cost / revenue analysis can be made on top of all these metrics on a product.
I would like to hear Your opinion on my humble view. Thanks!
Please note:
• I am not very familiar with Agile
• Only seven years of experience in dealing with software product development
How about focusing on customer happiness? I mean the whole point in getting in to agile is to ensure customer is happy. May be most of the times happiness is perception than reality well I think it matters.
Assuming we have a good customer representative or the customer to interact as needed, at least in my team I am thinking about measuring customer happiness on 1-5 scale for
• Understanding needs
• Translating needs in to design (any artifact like prototype, design document basically anything which customer can understand that we are solving the right problem for him)
• Implementation – Timeline how good we are doing in terms of time to market on agreed set of problems to solve in defined iteration.
I am sure there is nothing new about measuring customer happiness. However I am interested in knowing your comments/experience about using customer happiness as metrics.
Thanks…
Customer happiness sounds good but it’s often a bit of a lagging indicator. I may want metrics I can look at earlier to know if my customer will be happy once we release. It also assumes that may customer is sufficiently well informed to know if the team delivered a good product quickly or not. The ultimate measure of customer happiness is when we have a lot of customers and can relate the number who are happy to the number who aren’t. This is the idea behind Net Promoter Score. See http://www.netpromoter.com/
Thank you for your quick response. I will certainly check more about netpromoter soon.
Yes I agree that we need something which tells me whether customer will be happy when I release the product or not. I am struggling to include customer in our development cycle. More than often we decide for our end customers and ignore product managers as well. In this situation I am thinking rather than any numbers like “Function Points†or “Lines Of Codes†some involvement from customer (product managers to begin with) might help. I am trying to avoid any metrics which helps only us (engineering) in saying we improved whether it makes sense to customer or not.
Mike-
Your example of comparing brain surgery and stamp-licking isn’t a fair comparison when discounting the notion of “complexity” in story points. They wouldn’t be the same kind of point as the nature of the work in each case is differnt and their “complexities” don’t mix! Rather, you would have, say, “surgery points” measuring various surgery complexities and “licking points” measuring various licking activities!
Story points (or any kind of “point” for that matter) should be a function of various factors like complexity, difficulty, # of tasks/acitivities, # of dependencies, etc. Story points should not be a function of time, skill level, or domain knowledge or other worker-based factors.
John–
I completely disagree and that was the point of this post. Story points are about time. No customer ever hires a team and then asks, “So, how complex is this?” Customers want to know, and teams need to estimate, how long something will take. Story points are estimate of relative duration. Yes, the other things can factor in (“Hmm, I think this will take such-and-such long, but there are few things that could go wrong so let me make add a little for that.”) The key with story points is that we don’t talk directly about the time, we talk about the relative size.
Mike-
I didn’t clarify this in my post, but we estimate relatively as well. One of factors we consider is “complexity,” but several others as well including “does the code need to be refactored?,” “how many modules we will code?,” “how much will need to be done to test it?”, etc.
After reading our posts again, it seems that maybe we’re really doing the same thing! It’s just that we have different ways of looking at the essence of story point. In either case we both want a “size” value and we’re both trying to get each of our teams to NOT talk about time during the estimation activity! (It’s so easy to do…sigh)
My only remaining question is this: if the team’s perception of estimation is rooted in “relative duration” and that is factored into their estimate, then as the team gains proficiency and domain knowledge, or just “gels,” wouldn’t stories tend to be estimated smaller over time?
This would seem to create a system that has a relatively constant velocity, but having more items getting done per sprint. Whereas in mine, story items are consistently sized, but the velocity increases as the team becomes more proficient.
Hi John–
Yes, an item estimated a year from now after a team jells or gets good with a technology would have a lower estimate. Picture a team that has learned Ruby over the past year. They might say, “This is only 2 story points because we’re good with Ruby now.” A year earlier they might have called that 10 because of the fumbling around they would have done while unfamiliar with a new technology.
To ask a team to estimate otherwise is impossibly difficult: you would be asking the team to abstract away the current state of the world and to estimate back to whatever level of knowledge/experience/etc they had don the first day of the project. This is impossibly difficult for a person who has been on the team the entire time. It’s flat-out impossible for someone who joined the team mid-project to estimate back to what things were like before he or she joined the team.
Hi Mike,
Following on the above thread, would it be acceptable for story estimates to decrease because of good design/architecture decisions the team made on older stories? The stories would be easier to complete and the design/architecture is already laid out. Yet, if you do decrease the points, then you’ve done away with relative sizing and you are now completing more stories at a lower velocity. For me, I would like to keep the points the same and simply increase the velocity.
Hi Z:
Work should always be estimated relative to the current state of the world–your current knowledge, the current state of the system, etc. Think about the opposite situation: What if the application had become fragile and hard to maintain. Would you want to estimate it in points with the assumption that the application is as it was? (Nice, clean and maintainable 4 years ago?)
Also: Could we even do this? I think it’s hard enough to estimate how long it would take right now to do something. But to estimate relative size based on old assumptions would be even harder.
I think we measure what it makes sense to measure in terms of what will deliver business value, for as long as it delivers value. One team I worked with was having difficulty with over-committing. At the end of each sprint we had an unacceptably high number of either incomplete or partially complete stories. What I ended up doing was establishign realistic, sustanable goal with the team, then adding Plan vs. Complete as a percentage on a scoreboard. We monitored it for a number of months until the team brought their plan vs. complete into an acceptable range.
Did they ‘game” the system? In a manner of speaking. They began committing to a bit less work each iteration until they reached a level where they felt it could sustainably be delivered. After a couple of months at this level we no longer needed to track this metric on our scoreboard, as the team had realized better planning and commitment practices, which was the goal in the first place.
Hi Greg–
Great example. We might call it gaming the system but we might also call it getting the team to behave in a better way. Most simple metrics like this work very well for a short period of time (as in your case) and then we move on to other metrics.
I’m joining the discussion a little late; and I hope it’s still open. I’m being directed to provide PMI-style metrics for agile projects (i.e. earned business value, CPI, etc). While I’ve read the PMBOK and am familiar with the concept, I have difficulty applying it to agile.
Do you have any thoughts/recommendations?
Are these types of metrics even valuable?
Hi Lanooba–
I have a chapter on metrics in my Succeeding with Agile book. There is also a good paper on Agile EVM by Tamara Sulaiman on InfoQ.